cross-posted from: https://feddit.org/post/3142575
Be respectful
cross-posted from: https://feddit.org/post/3142575
It's crazy when you think about the whole supply chain: preparing the soil, ploughing, applying fertilisers, applying pesticides, harvesting, processing, transporting, and then you just chuck it out and each step of production had its footprint.
It's crazy when you think about the whole supply chain: preparing the soil, ploughing, applying fertilisers, applying pesticides, harvesting, processing, transporting
It's also crazy how efficient modern agriculture must be to do all these things and get affordable products in the end
efficiency ≠ price
you've glossed over a lot of economics. Like, for one thing, the EU gives about €55 billion in agricultural subsidies a year.
Cost of production puts a lower bound on the price. In case of competitive industries, price floats just above that limit
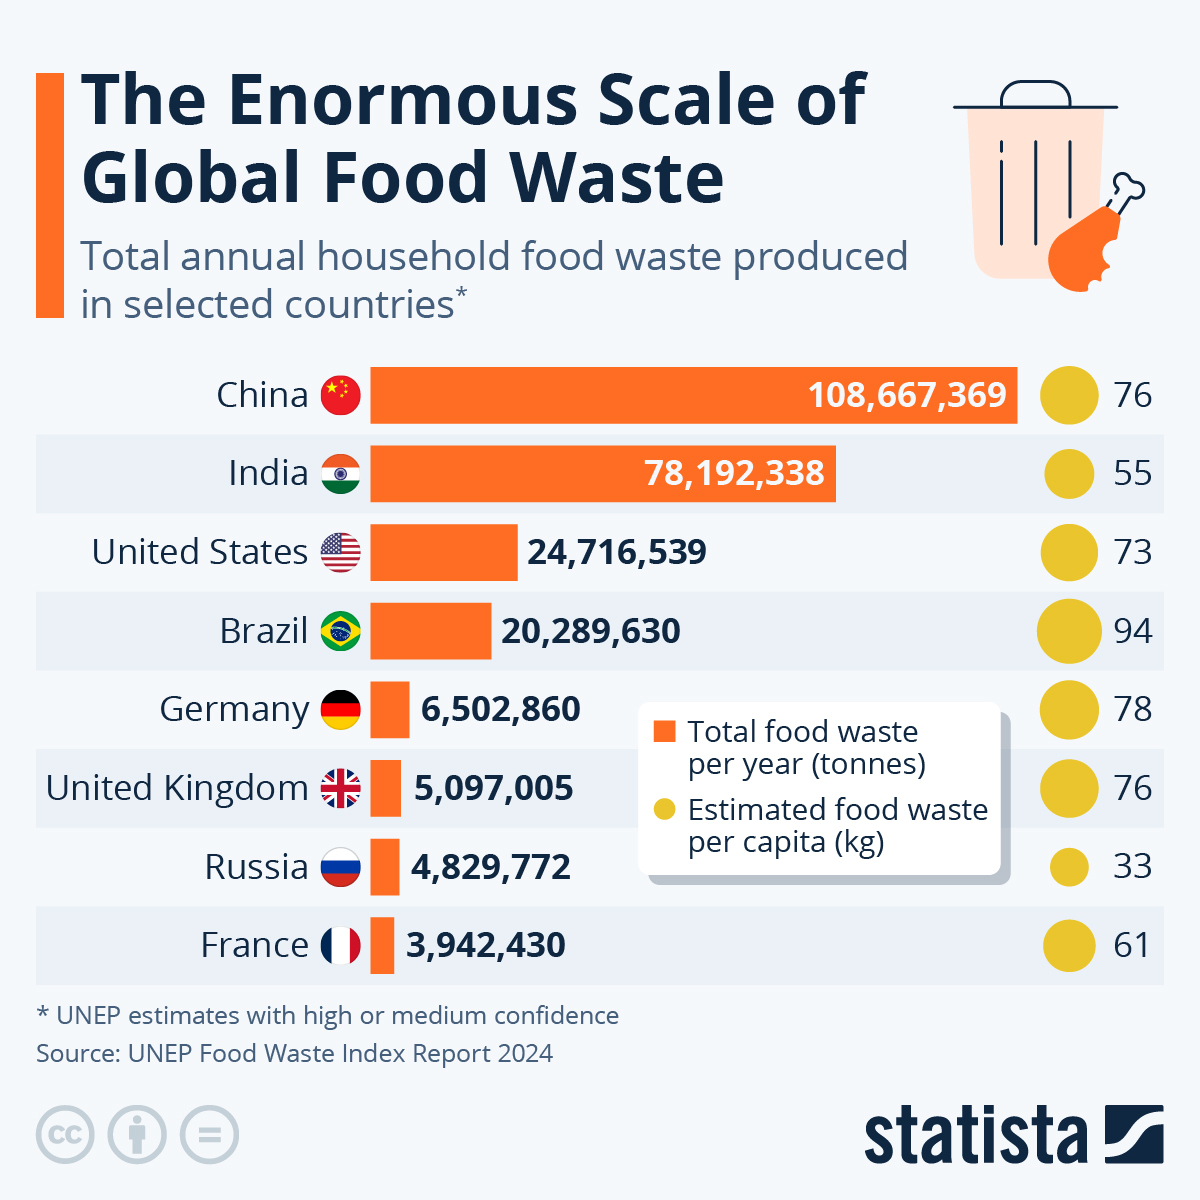
Data is fugly. Should be order by the per capita number , unless the intent was to mislead
Per capita with total as tiebreaker:
Brazil 94kg
Germany 78kg - 17% less than Brazil
China 76kg - 2.6% less than Germany
UK 76kg - 2.6% less than Germany
USA 73kg - 3.9% less than UK/China
France 61kg - 16% less than USA
India 55kg - 10% less than France
Russia 33kg - 40% less than India
Totally. There's really no point in using anything /except/ per capita!
I'm a person, not capita!
Well but how many heads do you have? If you have two heads do you eat same amount as 2 persons?
How much is this percentage wise?
NPR/USDA estimate that adults eat about 2000 pounds of food per year, so 94kg/2000 pounds = 10%. 73 kg/2000 pounds = 8%. Not bad, honestly, considering, for example, a banana peel is 12% of the banana.
So if they've shown percentage the numbers wouldn't really fit the agenda. Biased article is biased