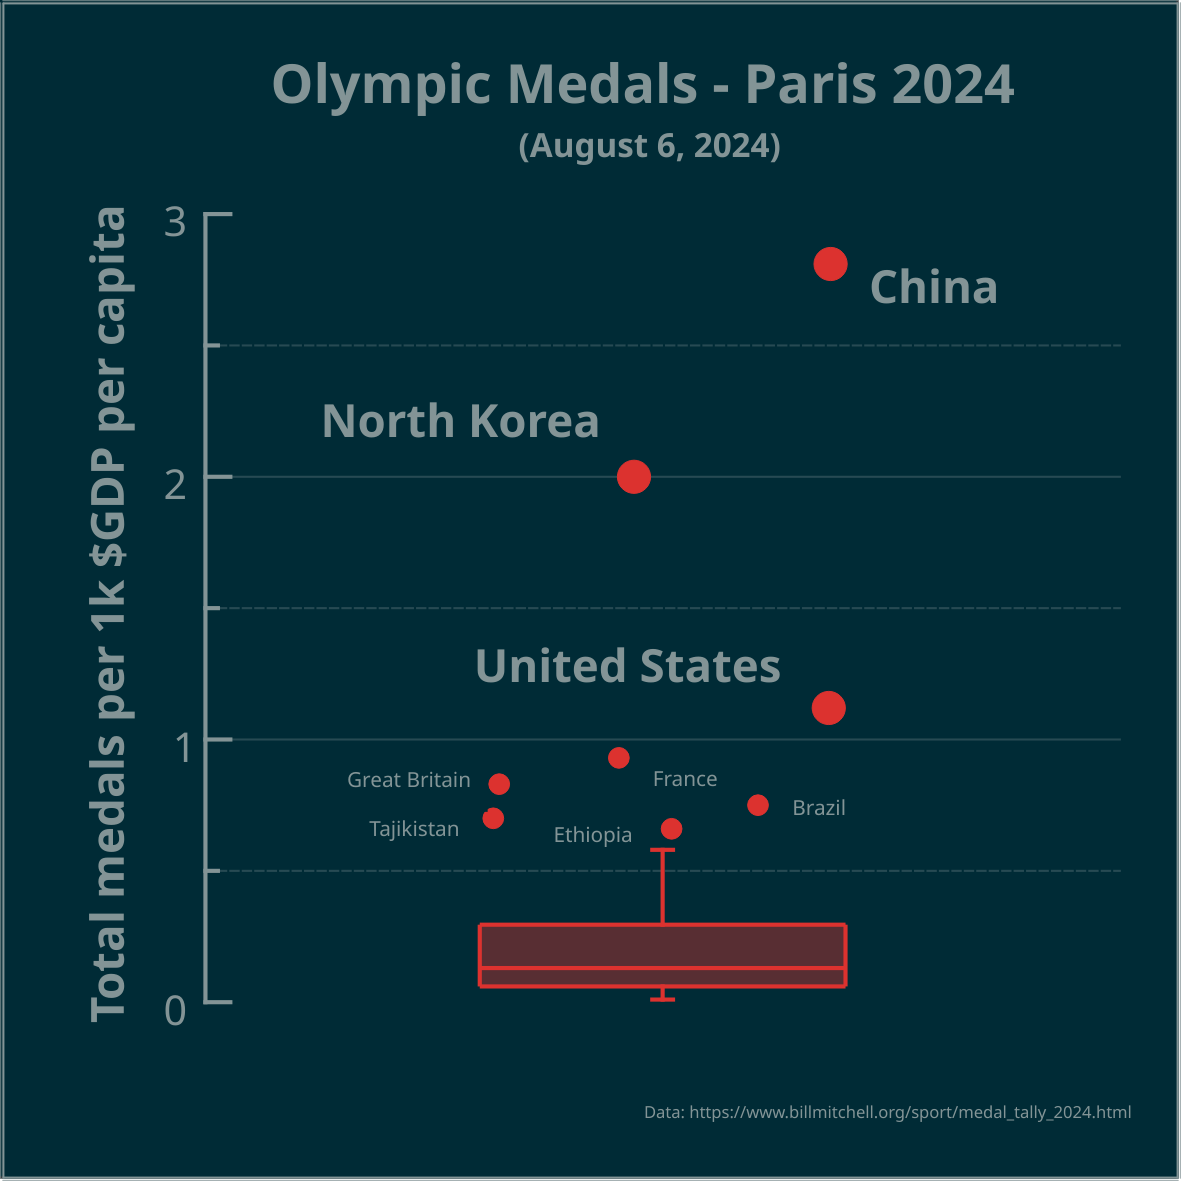
LabPlot

joined 3 years ago
[โ€“] LabPlot@floss.social 0 points 1 year ago (1 children)

@Eheran

Great question! And what's _your_ answer?

[โ€“] LabPlot@floss.social 2 points 1 year ago* (last edited 1 year ago)

@Sconrad122

Any exploratory plot forms a question and your comment shows how to look for answers. Thanks!

[โ€“] LabPlot@floss.social 1 points 1 year ago* (last edited 1 year ago)
[โ€“] LabPlot@floss.social 0 points 1 year ago (1 children)

@smeg

The points are jittered along the x-axis, otherwise the data points could overlap.

[โ€“] LabPlot@floss.social 1 points 1 year ago* (last edited 1 year ago) (1 children)

@NOT_RICK

Australia is the next country after Ethiopia, but it's not outlier in this case.

[โ€“] LabPlot@floss.social 2 points 1 year ago* (last edited 1 year ago)
 

โ–ถ๏ธ Total olympic medals per 1k $GDP per capita - Paris 2024 - represented in the Tukey's boxplot ๐Ÿ…

@dataisbeautiful

Is the highest number, relative to $GDP per capita, best? Outliers marked as circles. Made in #LabPlot, an open-source data analysis and visualization software.

Edit: the problem is framed as a question.

#Olympics #Olympics2024 #France #China #NorthKorea #USA #UnitedStates #UnitedKingdom #UK #Brazil #Australia #Japan #Italy #Canada #Germany #Spain #DataAnalysis #DataViz


Merry Christmas from the LabPlot team! ๐ŸŽ… ๐ŸŽ„

@opensource @kde
#Christmas #FOSS #FLOSS #OpenSource #KDE #LabPlot #DataScience #DataViz

view more: โ€น prev next โ€บ