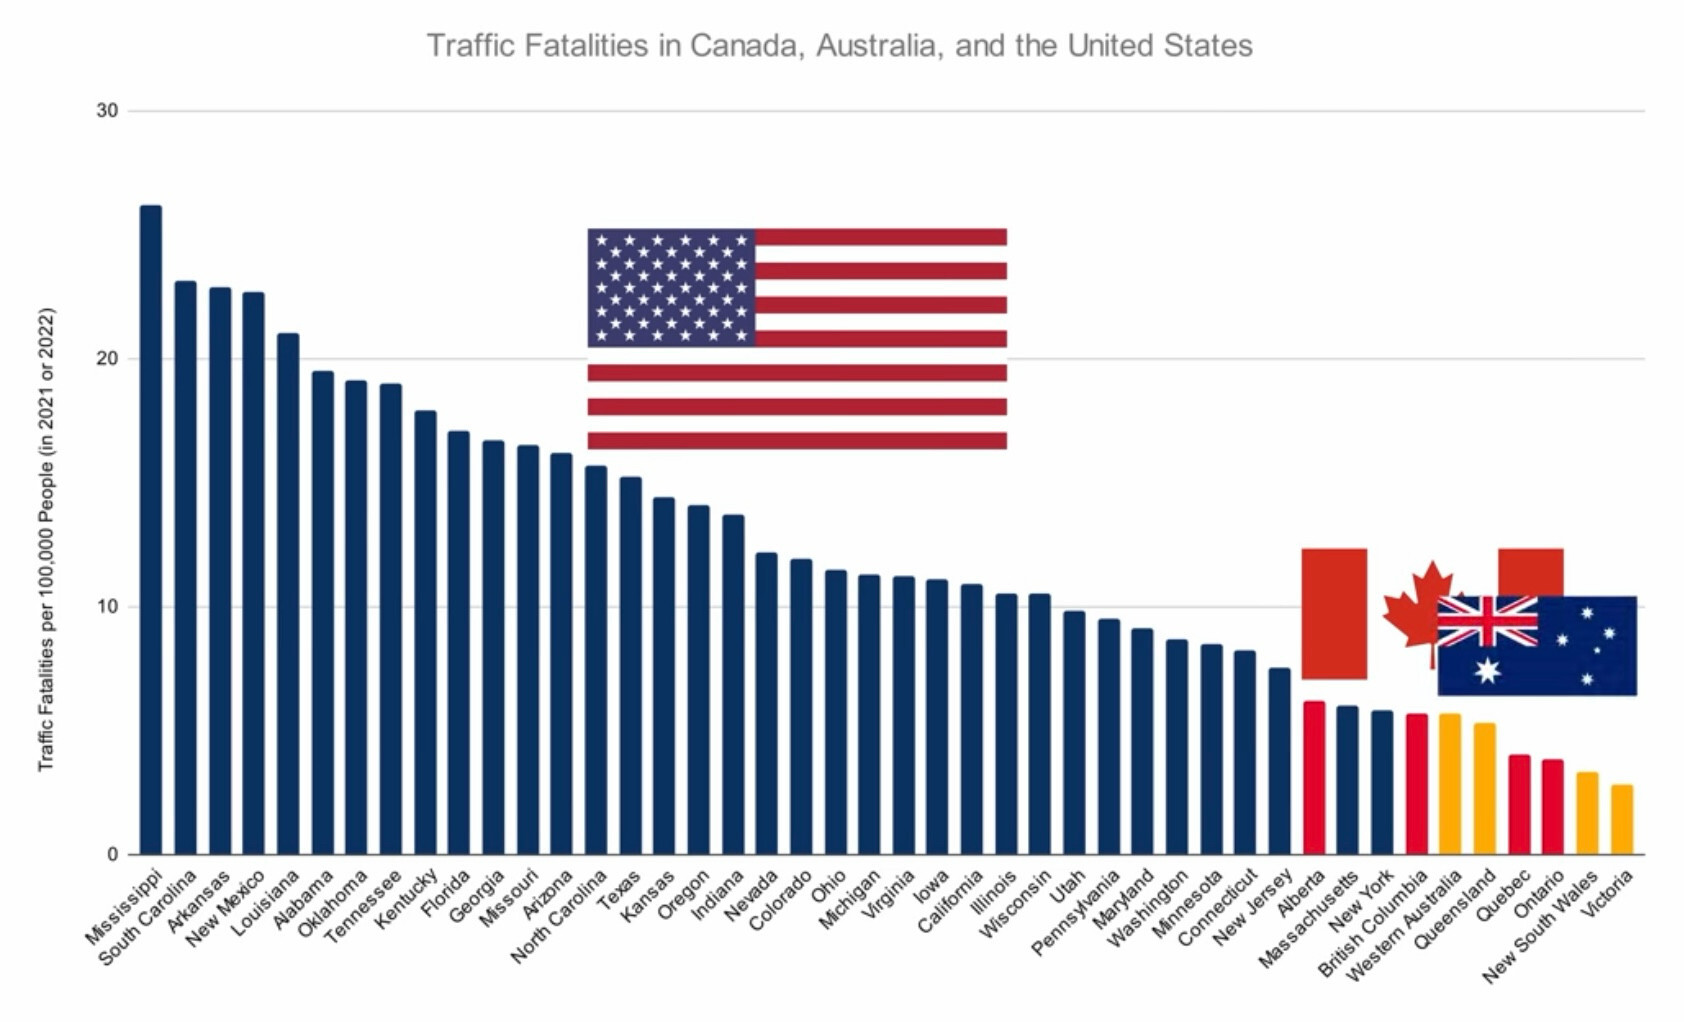
New Jersey is too low. Serious doubts about the validity of this table.
Mildly Interesting
This is for strictly mildly interesting material. If it's too interesting, it doesn't belong. If it's not interesting, it doesn't belong.
This is obviously an objective criteria, so the mods are always right. Or maybe mildly right? Ahh.. what do we know?
Just post some stuff and don't spam.
Took a closer look to see if I was surprised by any correlation about poverty, and browsed away with the belief that the south is still a shithole... which might still correlate with poverty. I think kansas/oregon is the first entry that wouldn't be 'south.'
I'd like to see the % of trucks vs cars for each location.
The south is killing it!
How you know this is good data
- No sources. Just a chart.
- Randomly compares some places in North American to some places in Australia.
Not surprised by SC, as a Canadian I had one accident in 40 years of driving, it was in SC, caused by a 17yo girl driving an old suburban or something.
USA #1! 🇺🇸🦅🇺🇸
Is it the issue of safety standards?
I'm guessing there is some correlation to total miles(/km) driven. Not all of it, but some. If people in one location drive drastically less distance annually, I'd expect their numbers to show drastically lower on the chart, as well.
I am not convinced with Australia and Canada being much better? It would make sense if you were comparing to Europe.
. . . Huh. Here in Vic every year we get targeted with so many ads being like 'worse year ever for road deaths, drive safe, etc'
Chart is incomplete
Every state above 2M
That excludes data. This is a terrible display of statistics as another commentor points out. Totally useless information.
No, it is literally just comparing similarly sized jurisdictions.
Then OP should learn how to put relevant info into the post.
It's in the linked source.
Should be on the graph