Source: Pew Research Center
This is for strictly mildly interesting material. If it's too interesting, it doesn't belong. If it's not interesting, it doesn't belong.
This is obviously an objective criteria, so the mods are always right. Or maybe mildly right? Ahh.. what do we know?
Just post some stuff and don't spam.
Source: Pew Research Center
Kind of a weird graph....
But they're shown on the same bar graph, which implies they're shown on the same scale. Right? or am I misreading this?
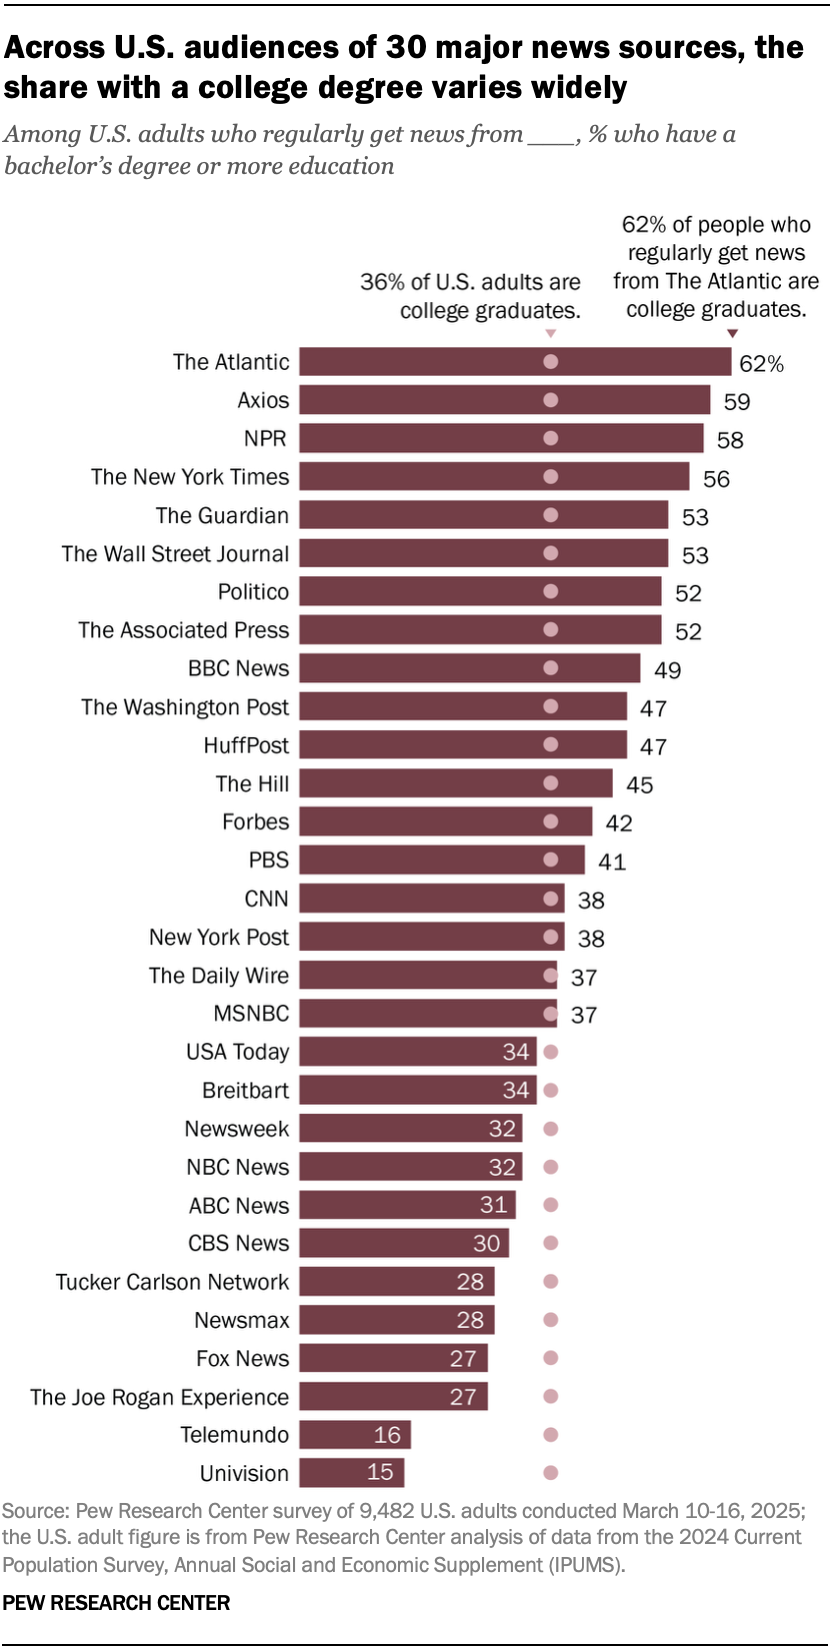
It's not "what % of college graduates get their news from this source", it's "what % of adults that get their news from this source have a college degree"
OK you're right. the scales are:
So the scales are still different.
I'm guessing they'd make an argument that: "If the college graduate readership were distributed evenly across all news sources, then (given magazine) would have (the percentage of all US adults who have a college degree)." But the labels don't say that, which is why it is confusing.
Imagine "All Americans" as one of the bars like the others - its just another cohort.
no, "Among US adults who regularly get news from ____, % who hav ea bachelor's degree or more," not all US adults with a degree, just all adults
OK you're right. the scales are:
So the scales are still different.
I'm guessing they'd make an argument that: "If the college graduate readership were distributed evenly across all news sources, then (given magazine) would have (the percentage of all US adults who have a college degree)." But the labels don't say that, which is why it is confusing.