this post was submitted on 30 Dec 2024
1503 points (98.7% liked)
Microblog Memes
11840 readers
1541 users here now
A place to share screenshots of Microblog posts, whether from Mastodon, tumblr, ~~Twitter~~ X, KBin, Threads or elsewhere.
Created as an evolution of White People Twitter and other tweet-capture subreddits.
RULES:
- Your post must be a screen capture of a microblog-type post that includes the UI of the site it came from, preferably also including the avatar and username of the original poster. Including relevant comments made to the original post is encouraged.
- Your post, included comments, or your title/comment should include some kind of commentary or remark on the subject of the screen capture. Your title must include at least one word relevant to your post.
- You are encouraged to provide a link back to the source of your screen capture in the body of your post.
- Current politics and news are allowed, but discouraged. There MUST be some kind of human commentary/reaction included (either by the original poster or you). Just news articles or headlines will be deleted.
- Doctored posts/images and AI are allowed, but discouraged. You MUST indicate this in your post (even if you didn't originally know). If an image is found to be fabricated or edited in any way and it is not properly labeled, it will be deleted.
- Absolutely no NSFL content.
- Be nice. Don't take anything personally. Take political debates to the appropriate communities. Take personal disagreements & arguments to private messages.
- No advertising, brand promotion, or guerrilla marketing.
RELATED COMMUNITIES:
founded 3 years ago
MODERATORS
you are viewing a single comment's thread
view the rest of the comments
view the rest of the comments
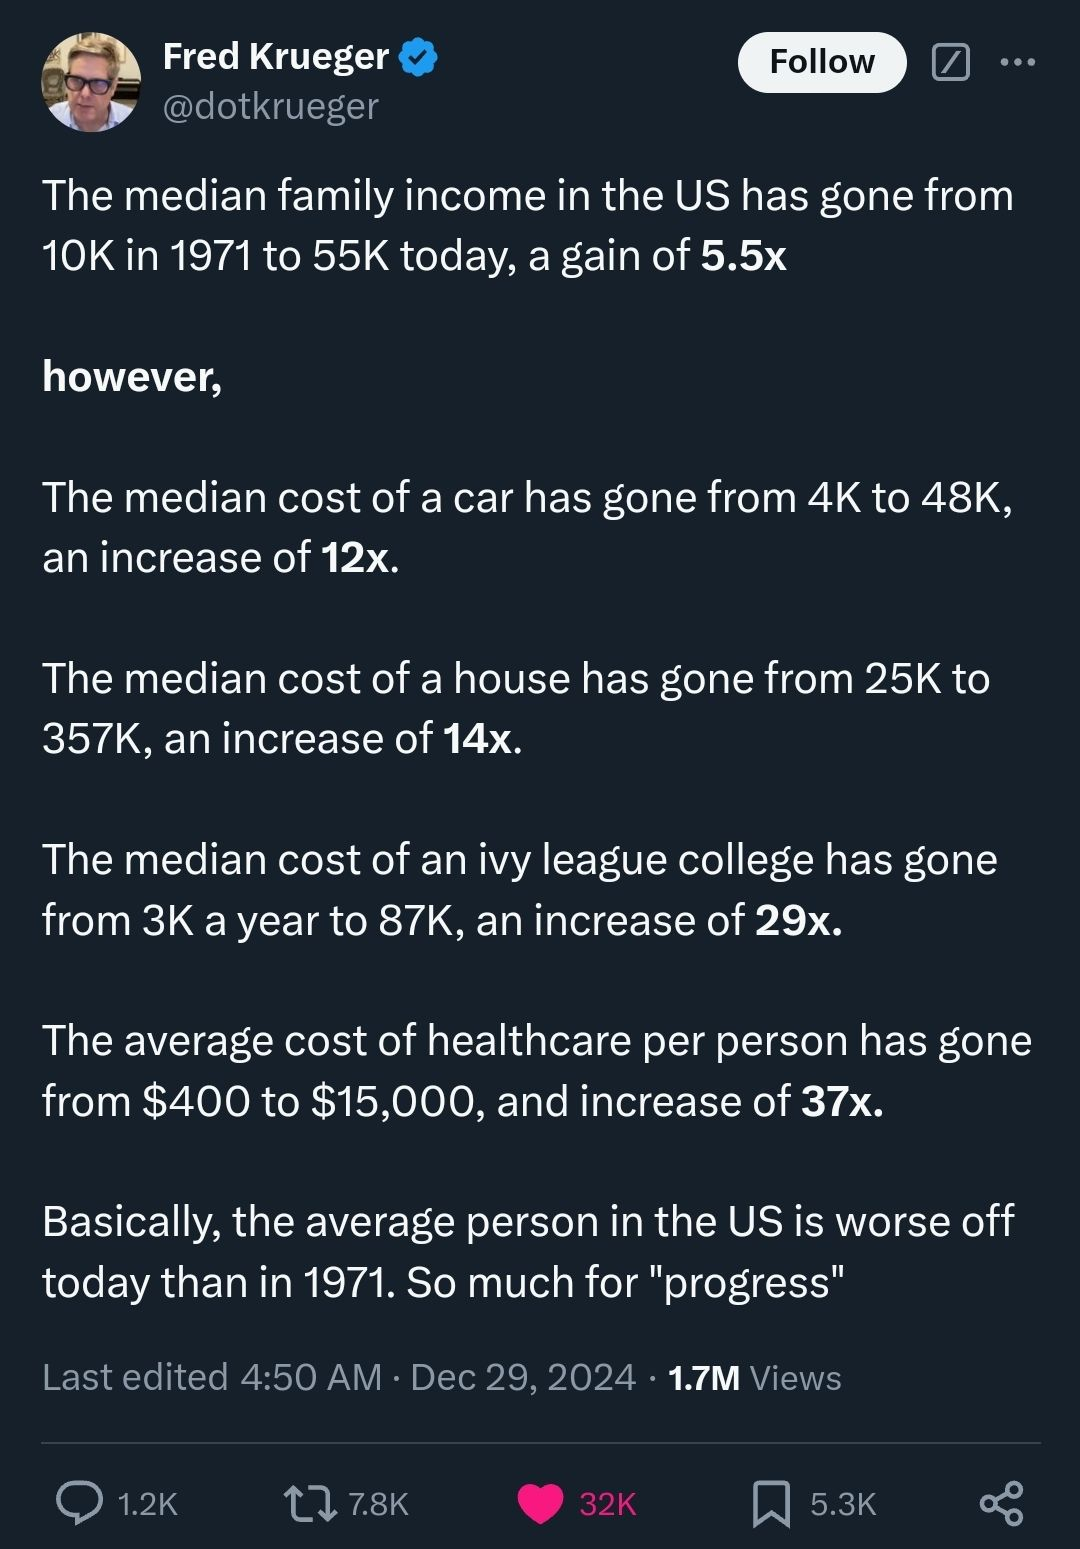
The first stat is a little misleading IMO. While the median car cost has increased ~2x (inflation adjusted), an entry level car price has only gone up ~1.2x (1971 AMC Gremlin vs 2023 Kia Rio LX; $1.8k/$14.8k vs $17.8k) and that's more important for measuring relative quality of life.
Of course add on to that the fact that there's easy access to second hand car markets and the number of features included with that base model vs the 1971 AMC Gremlin and it doesn't seem like things are much worse.
Basically, average car prices increasing could just indicate that people are willing to spend more on cars for whatever reason that may be (better features, more car-centric culture, etc.). For this reason I'd like to see similar stats but about entry level options within each category. Probably less sensationalistic but still interesting.
That being said, I bet stats for the housing market and others would still show a notable increase even at the entry level, but I'd still like to verify this before blindly jumping on the sensationalist bandwagon.
There's another important part of this equation: these are the things being sold. If someone can't afford any car at all, they still wouldn't show up in the entry-level car stats. But I think with how car-centric the US is, there won't be many people going carless? But like you said, if the second hand market is good, everyone could be driving a barely used BMW and they still wouldn't show up in any stats about new cars.
Basically, the only thing these stats tell us is that some people would have to spend a higher proportion of their income if they want to buy these things new. It doesn't tell us if that means they don't buy it, they buy it and go hungry, they buy an alternative, or they buy it without issue (because some other expense is cheaper or disappeared).
Inflation calculations try to account for this by considering a mix of products and services. If everything goes up across the board, people will get in trouble no matter their exact spending habits. You could also look at buying power or discretionary income to see if a population is doing alright.
The prices above increased a little harder than inflation, so you'd expect to see that as a decrease in discretionary income. The same would happen if wages didn't keep up with inflation, which is a happy coincidence? Or exactly what the discretionary income stat is designed to do: show how much financial breathing room people have.
The reason is stifling car dependency, complete lack of alternatives, and large number of hyper-privileged man babies.
Also massive fuel subsidies allowing vehicles to just get bigger and bigger, you can't even find small trucks anymore and there are only a handful of minivan options. EVERYTHING is an SUV!
I also want to know what those $25k houses are selling for now. Comparing to houses built in 2024 is stupid.
In 1988 my family home in the UK was 33k. We sold in 2011 for 185k. My house in 2014 cost 118k and is now worth 195k.
So, it's not that stupid.
So the 1988 home sold for about 6 times its purchase price and and the 2014 house is 1.65 times its purchase price. Both of those are way less than the 25x that the image claims.
But the graphic is stating from 1971 so 18 years before the 1988 house. In 1971 the average house price in the uk was about 5k.
You are the one conflating here.
Then provide the 1971 to 2024 numbers. A house built after 1977 can appreciate much less than a house built in 1971.
My house was 75k in 1990, I bought it in 2000 for 130k, the unimproved land value for the block it sits on (approximately the lowest value you could sell for according to local land titles) is now 400k